Understanding very long lengths is not easy. Other than looking into the distance, it is quite difficult for most people to think about kilometres, for example. You can easily think about a 50 metre long swimming pool, or a 100 metre long race track in sport, but after that it gets tricky to think about.
Some people are quite obsessed with visualising mathematical concepts. In 1977, the German installation artist Walter De Maria created a permanent art installation in Friedrichsplatz Park in Kassel, Germany. It is a 5 cm diameter brass rod that is 1 kilometre long. It has been embedded straight down into the earth so that only the top surface shows. So you have to imagine the whole length. All you can see is the round brass top in the centre of a 2x 2 metre red sandstone plate. The rod has a mass of 18 tons. The rod cut through 6 geological layers and took 79 days to install. Some people thought it was crazy to spend millions of dollars on something you can’t even see, but have to imagine. What do you think?
Walter De Maria also created The Broken Kilometre in 1979. As you might realise, he has displayed another 5 cm diameter rod, but this time you can see it, not as one total length but as 500 two-metre long highly polished lengths of brass, placed together as 5 columns with 100 rods in each column. This is a permanent installation at the Dia Art Foundation in New York. It has a mass of 17010 kg.
What might your class do to imagine a one kilometre length?
FAMOUS PEOPLE in MATHEMATICS
MARTIN GARDNER
Martin Gardner was born on 21 October 1914. He was a famous American recreational maths writer with over 60 books on maths puzzles. His most famous article in Scientific American was on trihexaflexagons. These were discovered by Arthur Stone in 1939, during WW2, when his new American paper would not fit in his English binder so he cut off the ends of the paper and began folding them into different shapes. A trihexaflexagon has 3 hexagonal faces, 1of which is always hidden. Just magical. It is made from ten equilateral triangles folded from a strip of paper. It can be flipped inside out and revealing just a front and back face each time. Gardner was a legend in 20th century recreational mathematics and helped make people all over the world become interested in solving maths puzzles. You can read more about him at http://www.martin-gardner.org
The German astronomer Caroline Herschel was born on 16 March 1750. Caroline discovered 8 comets and was the 1st woman to receive a Gold Medal from the Royal Astronomical Society (1828). The King of Prussia presented her with a Gold Medal for Science on her 96th birthday in 1846. She was only only 1.3 m tall, a good singer, and started out as just a hobbyist with her brother William, but, using high quality telescopes, they discovered more than 2400 astronomical objects over 20 years. She recorded all her discoveries and improved star maps. She also became the first woman to be paid for her work in astronomy. Her pension in 1787 was £50 a year, and it was the first money that Caroline had ever earned in her own right. What a woman!
Talking about real-life examples of gigantic numbers will help your students develop better place value concepts. Our Base 10 counting system operates with 10x, 100x, 1000 x and many more multiples of 10.
Today 1 866 134 284 978 MWh of solar energy reached earth. A megawatt hour is equivalent to 1 million watts of electricity being used for an hour. A megawatt hour (MWh) is equal to 1000 kilowatt hours.
A kilowatt-hour is a measure of the total use of electrical energy over a time period and is equivalent to 1000 watts of power (a kilowatt) being used continuously for 1 hour. A kilowatt is 1000 watts so 1 megawatt is 1 million watts of power.
A gigawatt is 1 billion watts of power meaning almost 2000 gigawatts of solar power reached earth today.
How strange that we don’t focus on solar energy collection more than we do. The world’s largest solar plant opened in China this month – the Huanghe Hydropower Development in China’s remote Qinghai province. Your students might like to research this project and discover lots more about huge numbers in our world.
Telling time is an important part of primary mathematics. But teaching these concepts should be part of your daily routines, not a separate topic to teach every now and then for a week or two in the year. Our suggested weekly timetables reinforce this idea.
It is the angle of the hands moving around that lets your brain see what time is represented on an analog clock. The crazy thing is that you don’t even need to show the numbers, just the hands and small regular marks on the circumference. The continuous movement of the hands in a circle shows time passing. To be honest you can tell the time even without these circumference marks. You could just have a blank circle and the hour, minute and second hands. We don’t need our students to draw the angle of the hands in a worksheet or class test. Even real-life watchmakers and clock technicians don’t have this skill. The mechanics of how the hands interact is all done by a machine, a wristwatch, a mantel clock or a large clock in a shopping centre. What we need to develop are the skills of reading information into the position of the hands, being able to tell the time. Clock time is a complex interplay of hours, minutes and seconds.
To help your students better understand the position of the hands, we highly recommend you use our Numberless clocks activity as a regular mental warm up. We also have small versions of this activity for small group use.
People say that coins and notes are going to disappear. There is too much doubt now about how safe it is to handle money in a post COVID-19 world.
Teaching our students about money will need to change dramatically. If we have no coins and notes, then understanding digital money will rely on place value concepts, number operations, decimals and percentages more than ever. The concepts will be invisible, not linked to real object demonstrations. Money lessons using model plastic and paper notes used to be a powerful practical way to demonstrate multiples of 10.
But financial literacy is proving to be a very complex goal to achieve. I am not sure how it will ever be effectively achieved with our primary students in the future as students need to see the value of numbers as real. If you have $100 in the bank you can only spend that much money without borrowing. If you just tap a card against a machine every time you see something to buy then the total amount spent and the total amount remaining to be spent need to be very obvious to the customer. Already the purchase of mobile phone contracts is a nightmare for some families. Imagine if everything becomes a digital purchase.
See our previous (prior to digital) Money Activitieshere.
See our (prior to digital) Money Photographs here.
Humans love to play games and do puzzles. Magic Squares are a difficult number puzzle and are not for the faint-hearted. You rearrange a set of digits to create rows, columns and diagonals that add to a given total.
The most famous Magic Square in the past is found on an engraving by Durer called Melancholia. Albrecht Durer was born on 21 May 1471 in Germany. He was one of 18 children and learnt to be a goldsmith and jeweller from his father and a woodcut designer from the leading craftsman at the time. But Albrecht was also a skilled painter at 13. Other artists taught him about the linked beauty of mathematics and art and he became a serious student of mathematics, perspective and proportion, studying Euclid in particular. Albrecht believed other artists might be jealous of him so he refused dinner invitations when travelling abroad in case someone tried to poison him. One of his most famous engravings is Melancholia, created in 1514.
This engraving famously shows a 4 x 4 Magic Square in the top right of the picture and the bottom row shows the date.
In a 4 x 4 Magic Square each row, column and diagonal add to the same total, in this case 34. Finding a solution is almost impossible so they are also known as Diabolical Squares.
You can try one for yourself using our Stage 3 (Grades 5/6/7) Addition and Subtraction Magic Squares activity by clicking here.
We provide a sample solution so that you can see it is possible to solve it.
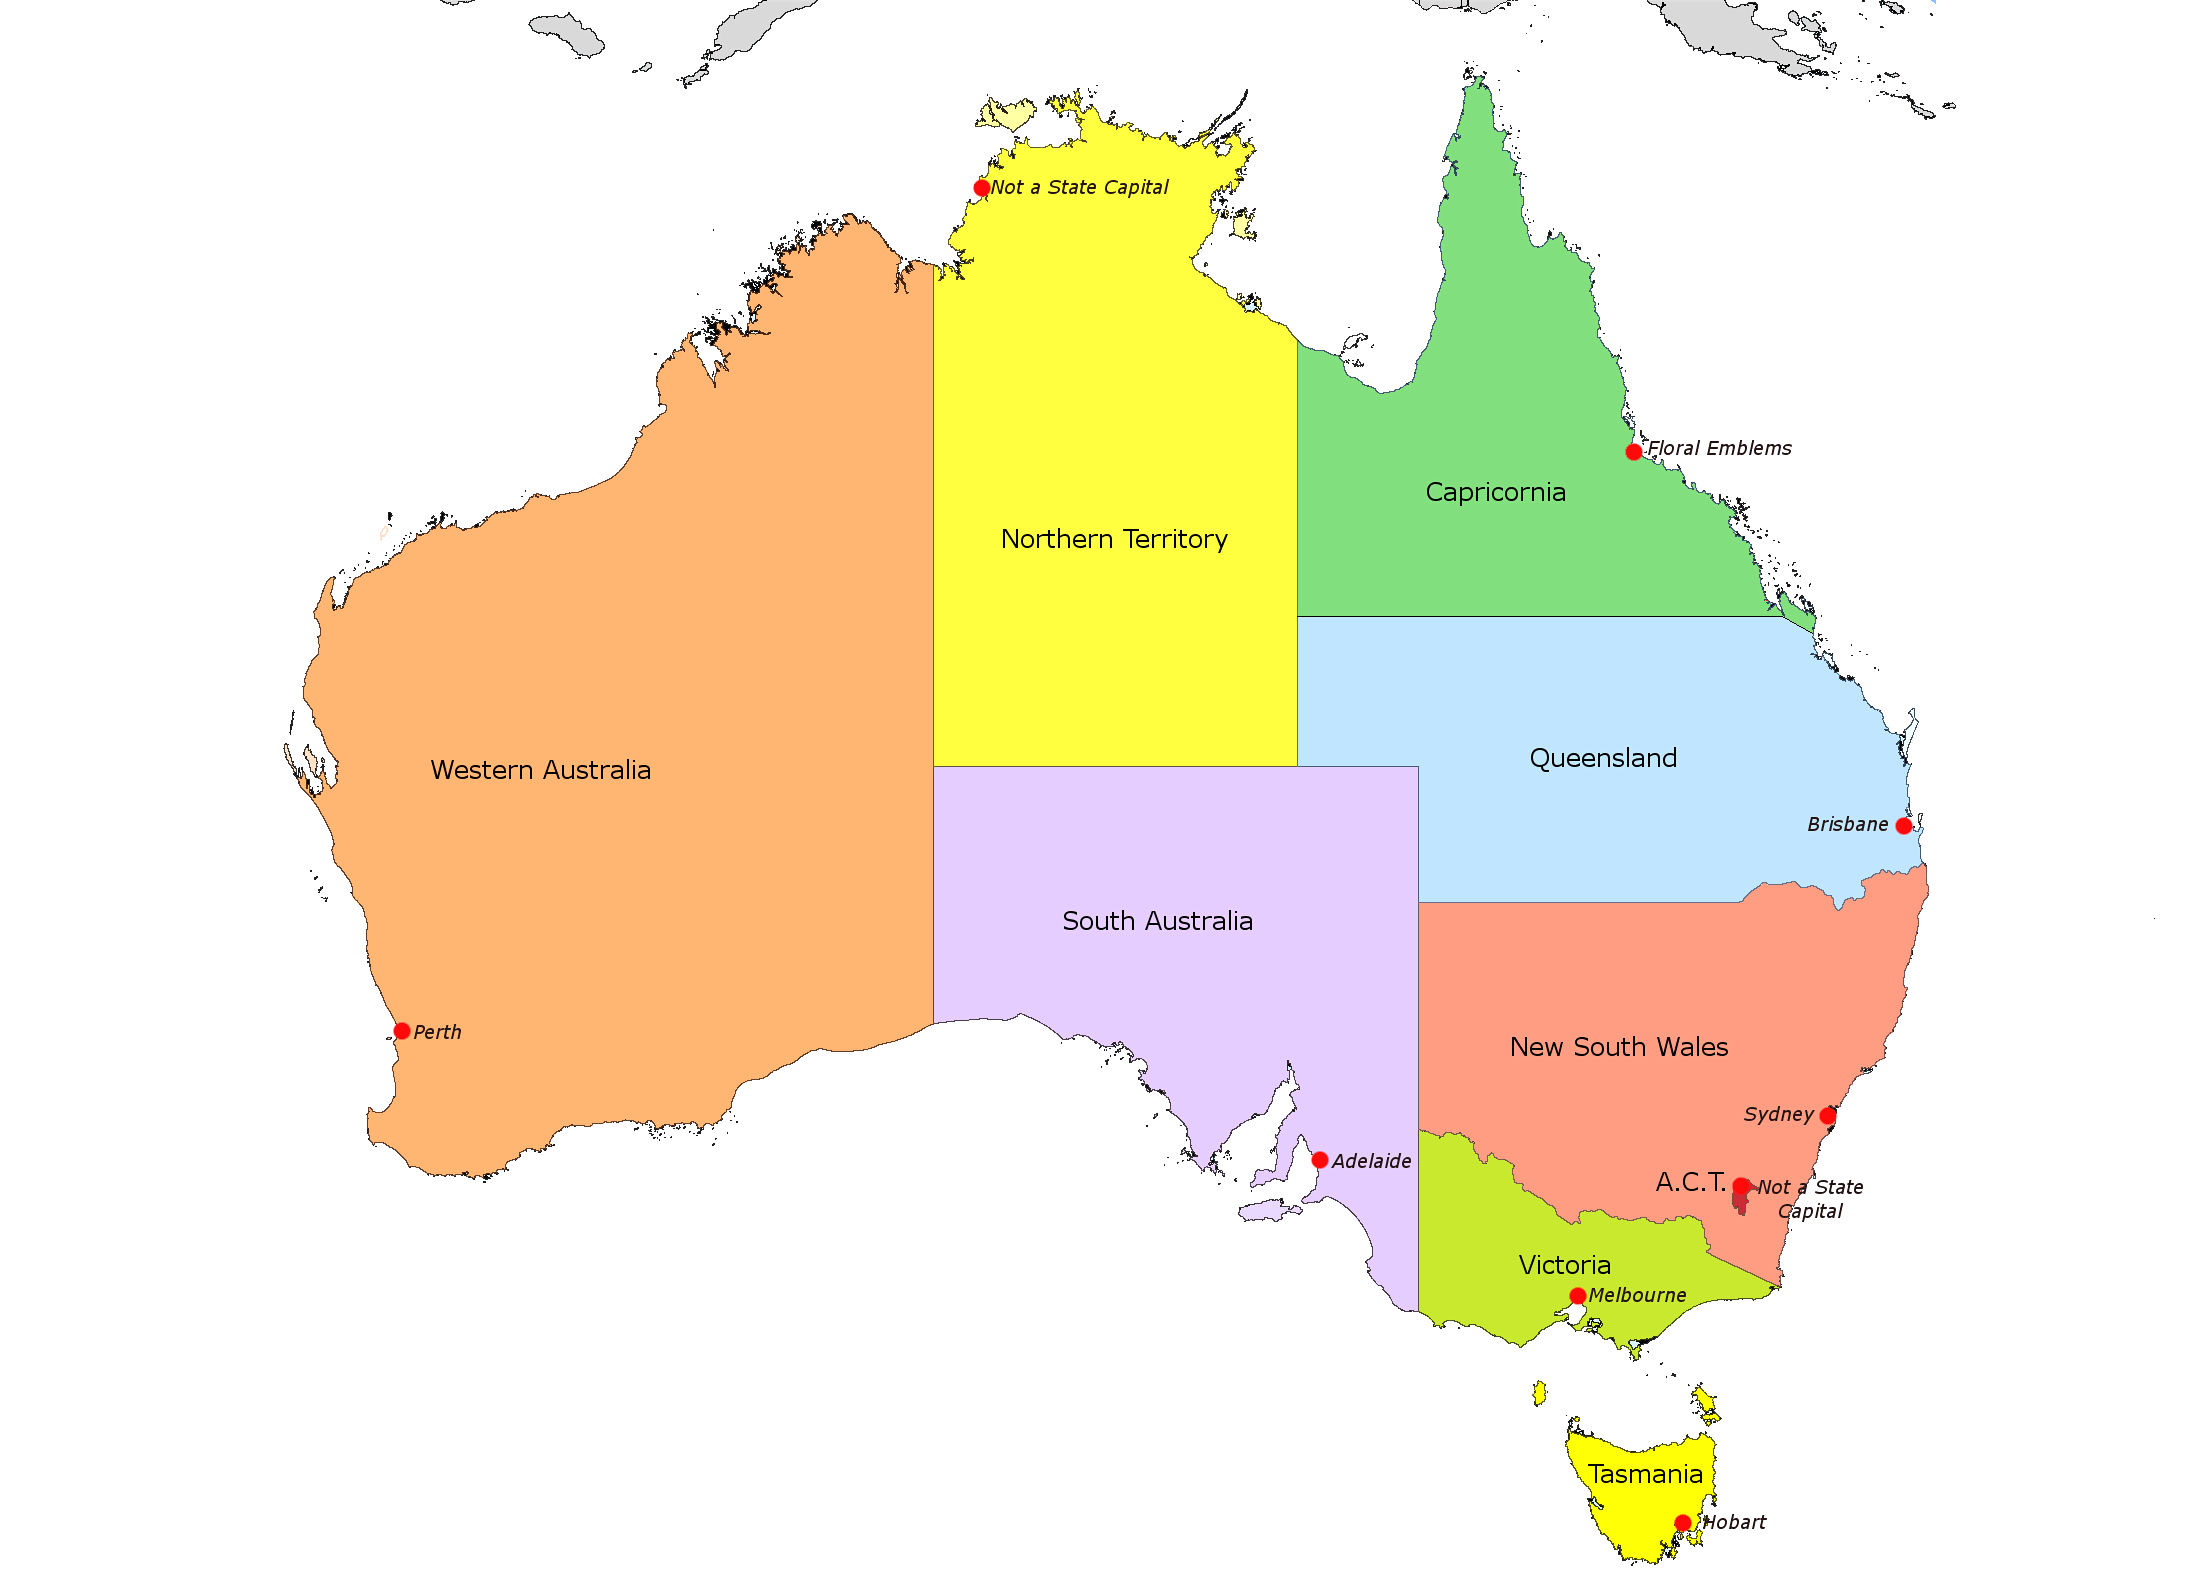
It’s amazing when you see the world from a different perspective. Normally we compare the size of different countries by looking at them on a map of the world. But what happens if you increase your understanding by a new arrangement? This map of Australia shows many different countries to scale on the map of Australia. Now you can see how really large Australia is. France, for example takes up the same space as the top of the Northern Territory. If we could move it, it also takes up about the same area as one third of NSW.
As part of an understanding of size in a series of AREA lessons for Stage 3 students, try selecting just one country, e.g. Japan, make multiple paper copies of this and then cut and paste it without overlaps to cover a paper map of Australia. Estimate how many you will need. You could try a new country every day.
We measure large areas in square kilometres. That’s equivalent to a 1000 x 1000 metre square or 1 million square metres. This area can take many different shapes, such as a 10 x 100 000 m square or a 100 x 10 000 m oblong, as long as the total area is 1 million m².
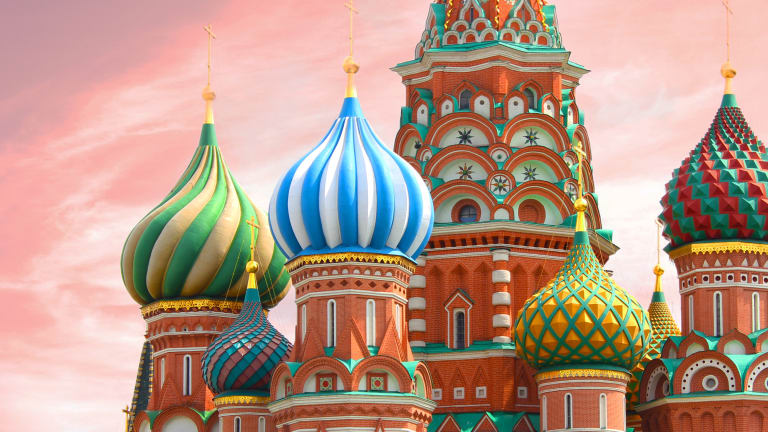
Planet Earth has a total surface area of 510 072 000 km². But the total land area is only 148 940 000 km² and the rest of the surface is water. Land makes up 29% and water covers 71% of the total surface area. The largest country is Russia with an area of 17 098 242 km², while the Vatican City is our smallest country with an area of only 0.44 km².
Did you know that Russia is the largest country in the world with an area of 17 098 242 km²? That’s 11% of earth’s total landmass. In comparison.
Investigating the area of countries is a great way to explore not only area but the use of very large numbers in a real life context.You can make a list of the TOP 10 largest countries or even the Top 10 smallest countries. What do these areas look like when compared with each other? For example, The area of Australia is 7 692 024 km², making us the 6th largest country. Australia is a bit less than half the size of Russia. But the area of Brazil is 8 515 767 km² so that makes it almost exactly half the size of Russia.
If you haven’t already discovered it, WORLDOMETER is a brilliant site packed with mathematical information, especially for your Stage 3 students.
And of course you can explore further AREA ideas in our Maths Matters Resources here.
Try to include mathematical jokes in your maths sessions as often as possible. Suggest your students make their own collections too. Make time to discuss why each joke is/is not funny. For example I really love this one shown below. You don’t need to know who Schrodinger actually was to appreciate this joke.
Schrodinger was a Nobel Prize-winning Austrian physicist who developed a number of fundamental results in quantum theory. Schrödinger’s cat is a his famous thought experiment, sometimes described as a paradox, devised by Schrödinger in 1935, though the idea originated from Albert Einstein. It questions whether a cat in an enclosed box is dead or alive, or could it actually be both, to illustrate the absurdity of the existing view of quantum mechanics. But we don’t need to know or understand any of this to get this joke.
This joke works in English but of course may not work well in other translations. It would make a lively discussion point with your Stage 3 students. Why not give it a go?
Facts about the universe are a great way to discuss large numbers with your students.
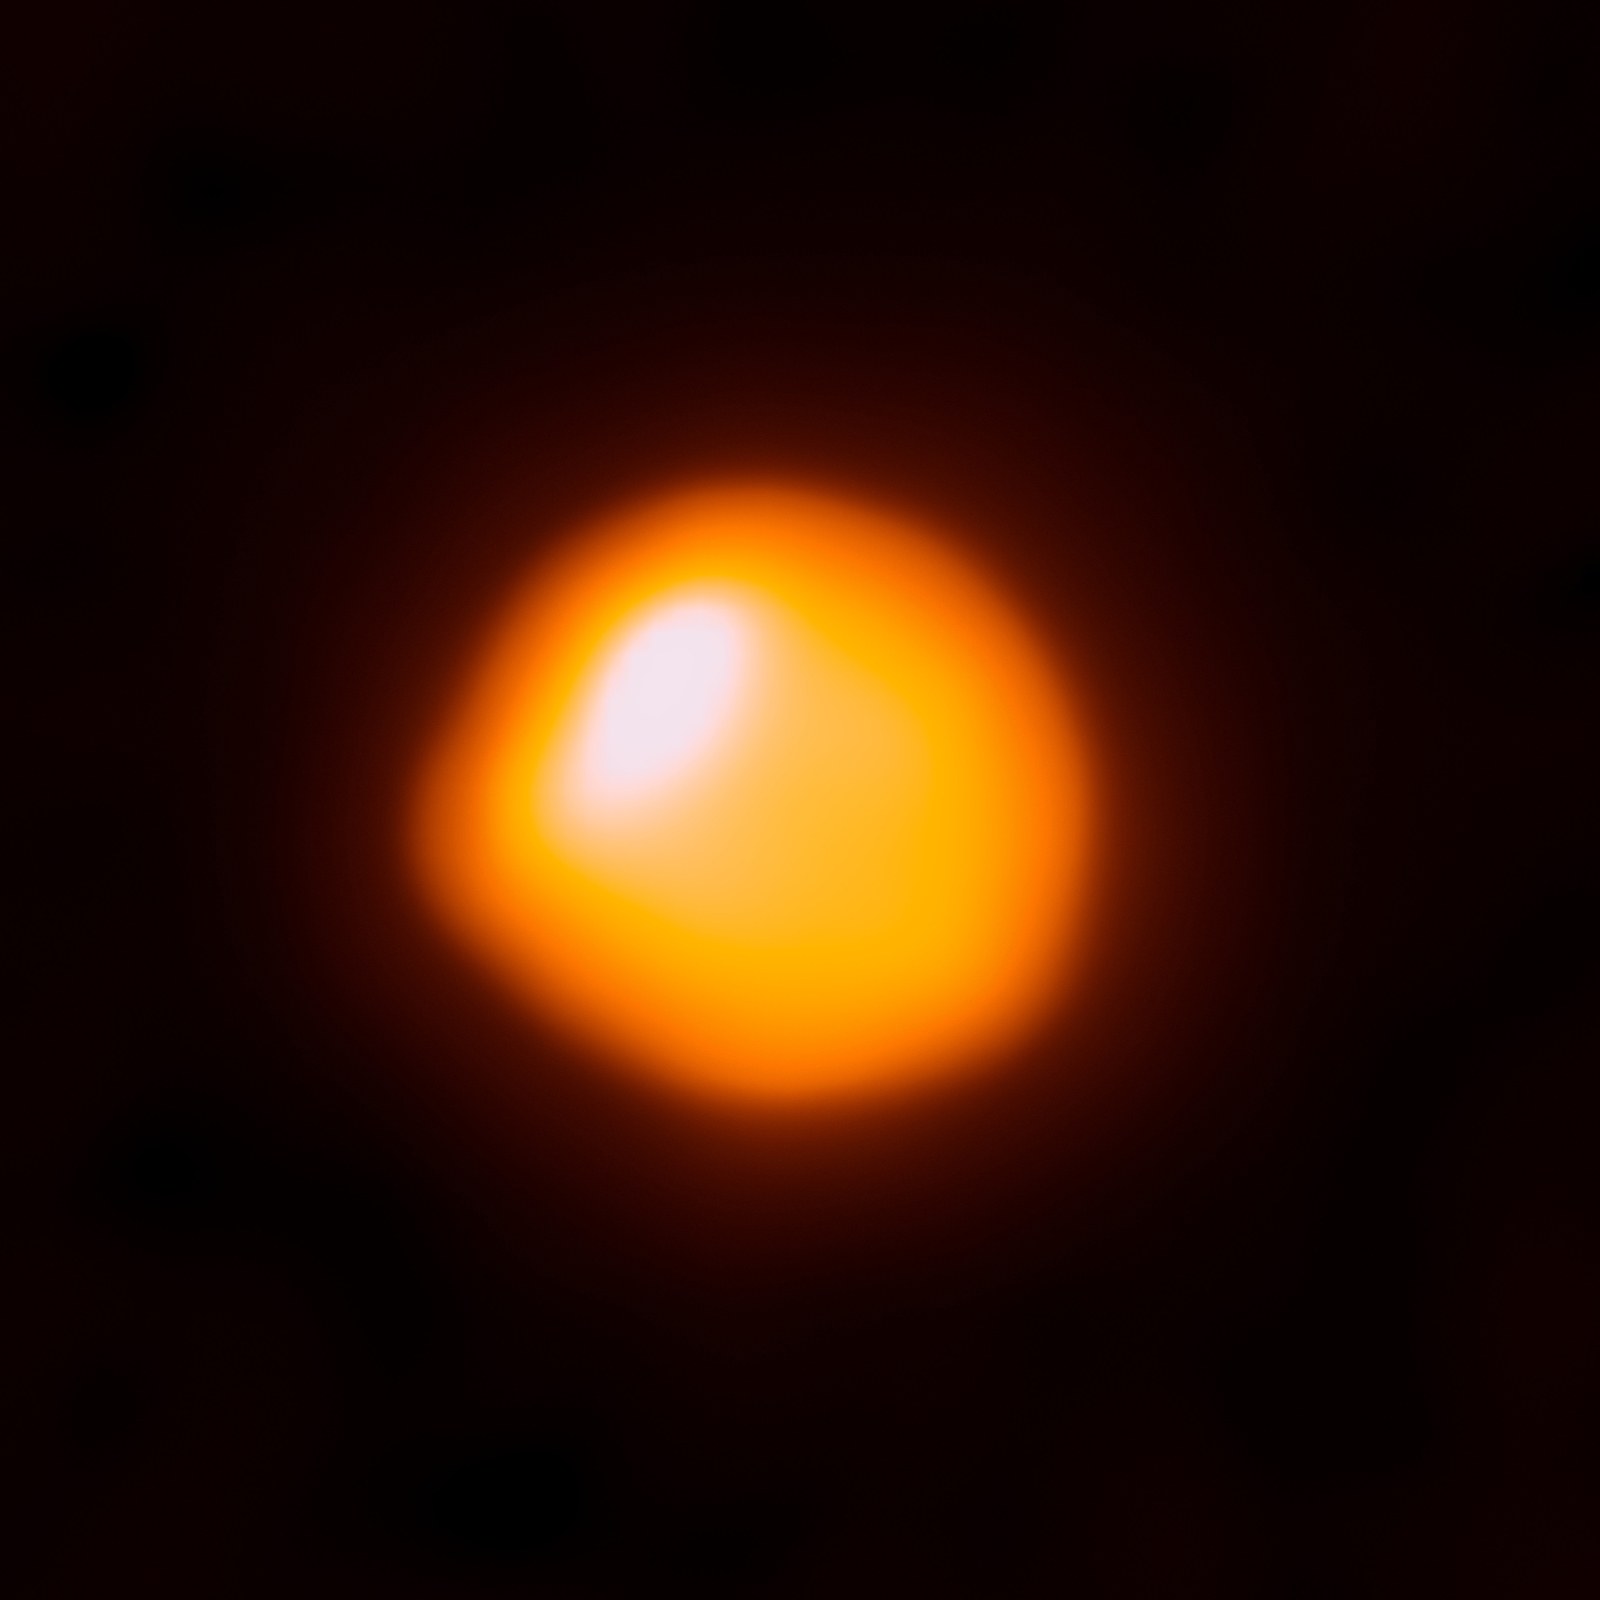
Betelgeuse is a red supergiant star from the Orion constellation. It is 640 light years away from Earth. That’s a very long way away. In a vacuum, light travels at 299 792 kilometres per second.
Betelgeuse is up to 20 times more massive than our sun. The mass of the sun is 1.989 x 1030 kilograms, about 333 000 times the mass of the Earth.
Red supergiant stars have neared the end of their lifetime and have substantially expanded. Betelgeuse has a radius of approximately 900 times that of our sun. Our sun’s radius is 696 340 km. If the sun was this size, its surface would nearly reach Jupiter.
Scientists predict that this star may explode soon, becoming a supernova. Well … maybe sometime in the next 100 000 years!
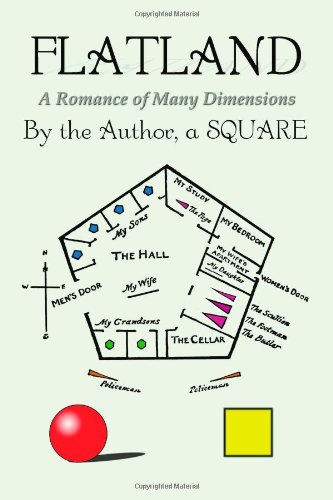
Edwin A. Abbott was born on December 20 1838. Abbott was an English school headmaster and theologian who in 1884 wrote a very unusual book, Flatland: A Romance of many dimensions, under the pseudonym of “A square”. It predated Einstein’s ideas about the 4th dimension and is a social satire which tells the story of a world where there are only two dimensions, no third dimension that would give us height. Men are polygons, women are line segments and a circle is the perfect shape (an infinite polygon). A film was made about it in 2007.
The funny thing is that when Duffy and I first met way back in the late 1980s we discovered that we both had a copy of this unusual book. I know of only one other person who had a copy, my friend Bill Barry, a famous mathematics educator from Sydney in the 1960s through to the 1980s.
Perhaps thinking about the world as only 2D can help our primary students understand 3D better. Imagine as a girl you are a straight line. When you move you can move forwards or backwards and if you bump into anyone you would sort of bounce off them. However if you are a straight line and you move sideways, when you bump into someone you might hurt them as you would have a sharp point on either end.
Boys are polygons which mean they have at least 3 straight sides. So depending on how they move they might bounce off their 3 straight sides or hurt someone with their 3 sharp corners. And boys might also be a square or an oblong, or a pentagon and so on. They become more dangerous as the number of sides increase.
If you are a circle, no matter how you move you will bounce off other people in your area as long as their pointy ends or corners don’t stick into you. You can sort of move anywhere you like without worrying about who you might bump into but still trying to avoid those sharp points. But when you think about it, you would appear to be a straight line when viewed by a non-circle. Your centre would be closer to them and perhaps the outer parts of your “line” would be a little shadowy. It would be quite a subtle distinction. I think inhabitants would learn to tell the difference between encountering a circle or a non-circle and act accordingly.
So Flatland would be quite a scary place to live. It certainly gives you heaps to think about and discuss together with your students, especially with Stage 3.
Calendar skills are a part of TIME (Measurement sub-strand) in Primary Mathematics across the world. Today is 2 November 2019. It is the 306th day of this year (and it would be the 307th day if this was a Leap Year). Today’s date can be written in many ways – in Australia we write it as 2.11.19. Calendar discussions should be a daily part of your class mathematics routines, whether you teach Kinder ( 5 year olds) or Year 6 Students (11 year olds). Encourage your students to create a set of 4-5 quick questions each day. e.g. What day is it today? It is Saturday and it is the first of 5 Saturdays in this month. How many days are there in this month? There are 30 days in November so there are 28 more days to go to the end of the month. It is the 306th day of 2019 and there are still 59 more days until the end of 2019. What season is it now? November is in the last month of Spring. There are 3 months in Spring – September, October and November. The next season will be Summer. Is today someone in your family’s birthday? Or someone in your class? Your school? Did something memorable happen on this day in the past? In Mexico it is celebrated as part of the Day of the Dead.
You can find more TIME Mental Maths Warm-ups here.
You can find suggested TIME Classroom Activities here.
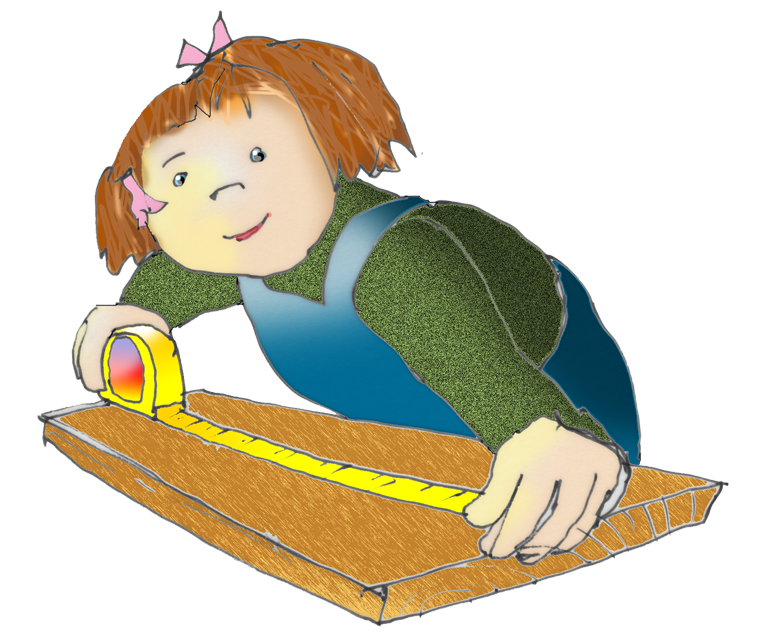
We recently found on our Facebook page that one post outperformed any other post in the 6 years since we created Maths Matters Resources. It relates to Length Measurements and is a graphic designed for Northern Territory Tourism.
So why is this height graphic so amazing? It very clearly shows us well-known tourist icons that help us visualise the actual height measurement of Uluru in the Northern Territory.
The ability to accurately measure height and length seems to be important to every culture on earth. You could fill a page with all the different words associated with length e.g. circumference, distance, kilometre, shorter than, furlong, as long as, narrow, centimetre.
The funny thing is, in length measurement, everything is relative. There is no higher than or not as high as, longer than or shorter than without a second length for comparison. A snake is longer than a crocodile only in some, not all circumstances. You are shorter than the height of most doors, but not all doors. You need at least two things to measure before you can make your judgment.
You can now easily estimate height using the icons on this graphic. The Eiffel Tower is almost as tall as Uluru so those of you who have visited Paris will have a pretty good sense of what that looks like. Similarly, if you have been to Egypt, the height of Uluru is about as high as two Pyramids of Cheops.
You can also think about length. Uluru appears to be a bit longer than 5 Sydney Harbour Bridges. If you are a Sydney-sider, that helps you imagine the actual Uluru rock far better than just saying it is 348 m high and 3.6 km long. The graphic doesn’t show the actual width measurement in metres of the bridge but you can imagine the image repeating more than 5 times to measure the same width as Uluru. The arch span is actually 504 m, plus the width of each pylon probably means the graphic image of Sydney Harbour Bridge represents a width of about 650 m.
The graphic also doesn’t mention that Uluru is about 1.9 km deep, has a circumference of 9.4 km and an area which covers about 7 square kilometres. Or that it takes about 3 hours to walk right around the circumference. Measurements galore.
The most important concept we can take from all this is that as humans we need help to visualise large measurements.
What are you doing to help your students do this? How high is your main school building for example? Perhaps you can find the tallest student in your class and make a paper strip to match this length. Everyone can estimate how many of these strips you would need to match the height of the building. You could then paste different colour copies of this length to make an even longer strip that has clearly marked sections. Is there somewhere you can go to drop this strip from a height to the ground? Using this measurement you can then estimate the height of your building e.g. 10 Jessicas. Check what you find against everyone’s estimates. Were they in the right ballpark? This paper strip can then be used to measure the width and circumference as well.
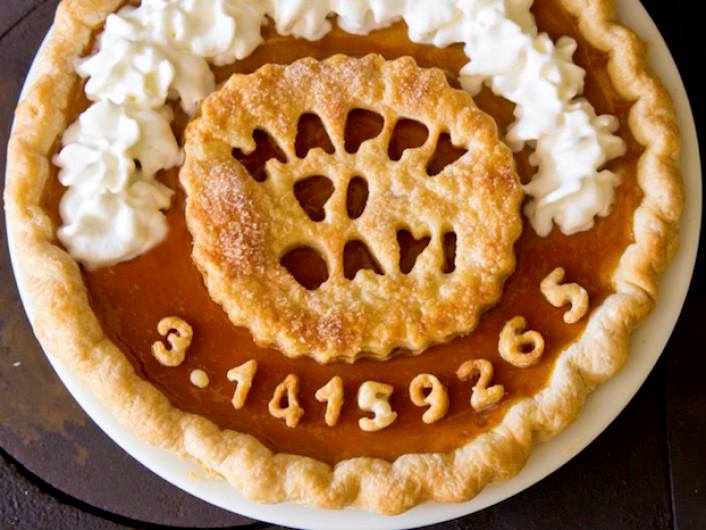
Happy Pi Day. In some countries the calendar dates are written with the month first. So the 14th day of March is written as 3/14. Just for fun, this day is now celebrated all around the world as PI day as the first few digits of pi are 3.14.
There are now so many sites that help you celebrate this event with your students. Pi is the mathematical tern for the relationship between the diameter and the circumference of a circle. The diameter fits around the circumference more than 3 times. This relationship is the same no matter what size circle you create. It is a number that never ends. But it is also a number where absolutely no pattern has ever been discovered. Humans find this astounding. They can’t believe that a number can exist without a pattern attached. They keep searching for one.
This relationship known in the times of the ancient Babylonians and Egyptians. The symbol π was first used to denote the circumference-to-diameter ratio in 1706 by Welsh mathematician William Jones. But it didn’t catch on until Swiss mathematician Leonhard Euler adopted its use in the 1730s.
In 2016, a Swiss scientist, Peter Trueb, used a computer with 24 hard drives and a program called y-cruncher to calculate pi to more than 22 trillion digits — the current world record for the enumeration of pi. If you read one digit every second, it would take you just under 700 000 years to recite all those digits.
March 14 is also Albert Einstein’s birthday. And physicist Stephen Hawking, considered by some to be Einstein’s intellectual successor, died on March 14 2018.
What can you do to celebrate PI DAY with your primary students?
A CymaScope is a scientific devise that makes sound visible.
By adding water to the membrane surface geometrical patterns made by different sounds become visible. The word “Cyma” is based on the Greek word for wave.
Beautiful patterns are created by musical instruments and also human voices.
These images might inspire your Stage 3 students to explore their own pattern-making using a pencil and compass. These ones are made by notes on a piano.
I don’t know if you have been to The Louvre but if you have you would know about the beautiful pyramid entrance structure built by the world famous Chinese American architect IM Pei. There is one large pyramid and three small ones in the main courtyard. It opened in 1989 to much controversy – an ultra modern structure next to the traditional French palace structure.
Made entirely of clear glass and metal poles, it is 21.6 m high with a 34 m square base. The surface area is 1000 square metres. The volume is about 9050 cubic metres. There are 603 rhombus shapes and 70 triangular shapes.
The Great Pyramid of Egypt, the Cheops Pyramid, is 138.8 m high now but was originally thought to be 146.5 m high – 280 Egyptian cubits. Each base side was 230.4 m long but with erosion the sides are now 230.24 m long. The total volume is 2 583 283 cubic metres.
Sbahle Zwane is a 10 year old boy in Johannesburg South Africa who has been wooing everyone with his maths thinking – solving problems in his head without the use of a calculator. His mother says that “he only wants to talk about numbers.” She realised when he was a preschooler that he had an ability to work with numbers beyond his age expectations. Sbahle claims he sees all the numbers inside his head. He is using mental maths strategies to calculate. Do you have students in your class who show extraordinary maths skills beyond their age expectation? If so, how are you providing for their thinking?
You can see him calculating here. When he grows up he would like to be a pilot.
We now offer a free subscription for everyone all over the world. We wish you all a brilliant lifetime of fun creating effective maths sessions for your students using all our resources. We will continue to provide you with the highest quality maths activities, photographs and graphics, all carefully sorted into both age and curriculum substrands.
Area is one of the most difficult Measurement sub-strands for your students to understand. We use spatial visualisation skills to estimate areas large or small. Areas include surface areas which can be curved and squiggly and difficult to think about. Area calculations also require skills iusing decimal operations (+ – x ÷). And when we talk about Area with our students, we need to use real life examples so that our students deepen their concepts of how area works in the world around them. It can’t be taught as just conversion facts and figures (e.g. How many square metres in a 2 x 12 rectangle?)
This old photo shows a man painting the Eiffel Tower. The total area of metal struts and surfaces that need to be painted regularly is about 250000 square meters. One litre of paint covers about 16 square metres. If the maintenance team need to give the Eiffel Tower 2 coats, how many litres do they need? How many tonnes of paint is that? If bulk paint works out at $5 per litre, how much does just the paint cost? The whole upkeep must be so expensive.
Photographs are a great way to springboard your lesson into real life.